User Guide
Reigstering & Logging InSetting Up a ProfileAdding a ServiceAdding DependenciesReportsAdding a Service KPICalendarDisaster Recovery PlanNews FeedAdding AssetsAdding InfrastructureMonitoringRegistering & Logging In
The first thing you will need to do is log in. To do this go to the ServiceView home page and enter your username and password.
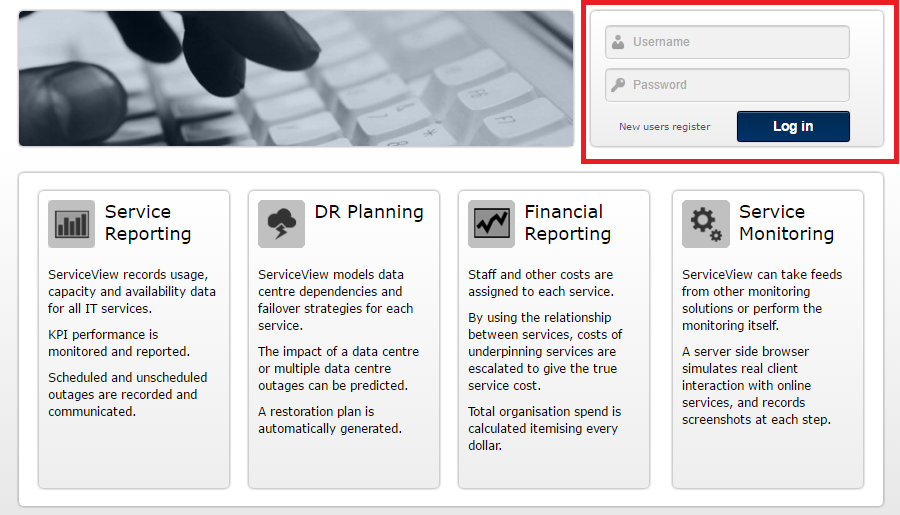
If you are not yet registered, you will need to click on the New users register link and fill in the required information.
Make sure you enter your name in the "Your name" field so ServiceView knows who you are. Click Register when all fields are completed.
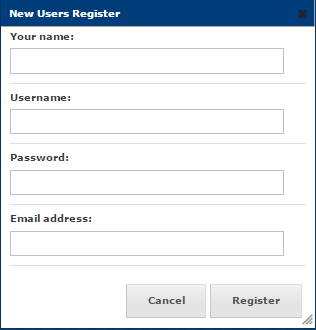
Once you have registered successfully you will be able to log in.
Setting Up a Profile
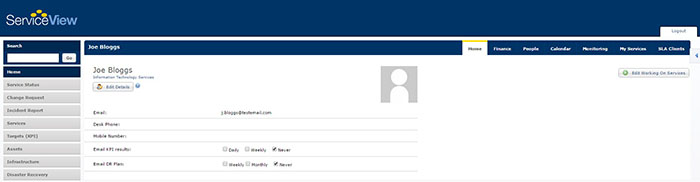
When you log in, it will take you to your user home page.There will be a prompt for you to edit your details. Make sure your name, email and phone numbers are correct.
Allocating My Services
On the home profile page there will be an area at the bottom of the screen where your sevices will be listed.
To add a service to your "Working on" list, press the Edit Working On Services button.
Add the services you are working on and the percent of time you spend on each service (FTE %). Once you have allocaed 100% of your working time, save your recent additions. This will contribute to an accurate graph, where you are able to view at a glance where your time is spent.
Watching a Service
Once you have allocated your services, you are able to view all of the services you are working on in the lower section of your home page.
In addition to be able to view your own working on services, you are also able to "watch" other services.
To watch a service go to the Services side menu and choose which service you want. Once you are on the service overview page, click the  button to add it to your services list.
You are able to change your watching status at any stage by entering the service screen and clicking or unclicking the watch button.
How to Add a Service
From the left menu bar, select Services and then select Add Service from the options.
The Add Service dialog should open.
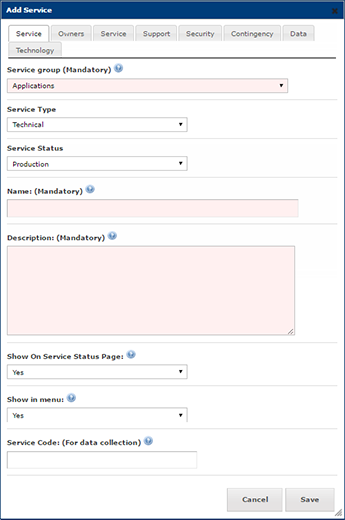
Click through the different tabs and complete all applicable fields, click Save when done.
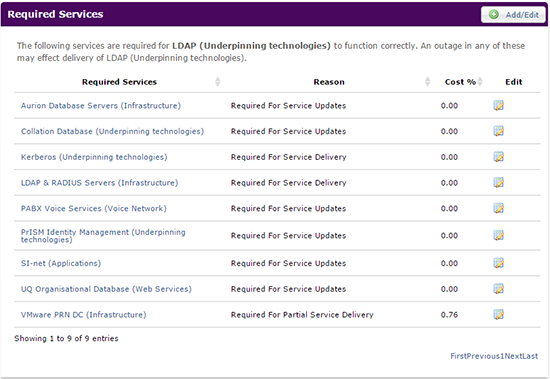
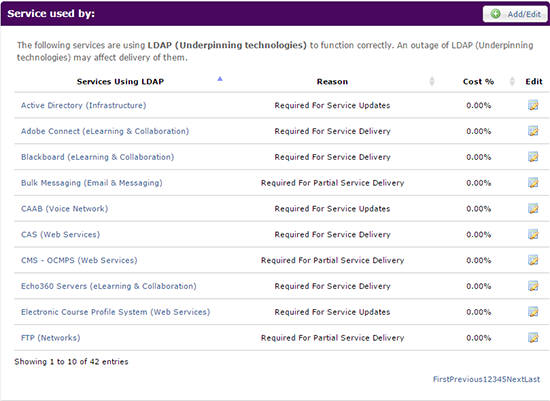
Adding Dependencies
Dependencies are used for looking at the relationships of services.
You are able to add and update the service dependencies at any time. To do this choose the service you would like to edit from the Services side menu then selecting the Dependencies tab from the top of the service page.
Adding a Required Service
To add a service that is needed for the chosen service to run, edit the Required Services section and fill in the reason (in the graph the reasons will be defined).
Adding a Service Used By
To add a service that needs the chosen service to run correctly, update the Service used by section.
Once the service dependencies are added, they will appear on the graph in the dependencies tab.
 ni
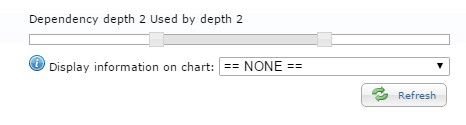
niFiltering the Dependencies Graph
To be able to view which sequence of dependencies you would lik to see, click on the Dependencies tab. In this tab there is an option area where you are able to choose the view:
- Show reduced dependencies
- Show all dependencies
- Show reduced using this service
- Show all using this service
Reports
On each service there will be a Reports tab. This tab will take you to view the chosen reports for each individual service.
In ServiceView you are able to view reports by month, quarter, year, three years or five years.
Add Event
To add an event on the graph, simply click the point in time where you would like to edit and it will take you to a dialog box.
This will allow you, for example, to tag a certain downtime and write an explanation.
Adding Metrics
Data is populated into the ServiceView database using agents. An agent is a script, usually running daily on the service infrastructure, collecting the data and then posting it to ServiceView. Agents can be written in any language as long as they are able to perform HTTP requests.
To add a Metric click the Add Metric button in the Metrics column at the bottom of the Reports page. This will open the Add Metric dialog.
Fill in all details and press Save.
Once the metric has been created, you will notice that there are 3 icons under the Link/Edit column to select from.

The  icon stands for Link or code that is needed for the monitoring script.
The  icon stands for Configure/Configure your Data.
To view the graph for the selected metric you will need to ensure that the tick box next to that particular metric is selected, then click on the 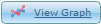 icon at the bottom of the screen. The graph will then be shown at the top of the screen.
Edit Report
To edit a report, click the Edit Report button. You are able to edit the name, description and the view restriction.
Save a Report
Within the dependency tab, you are able to save the report. This will be useful for future meetings and presentations.
How to Add a Service KPI
To add in a Service KPI, place the cursor in the white search box in the top left hand corner. Type in the name of the service and once located click Go.
Select the Reports tab from the top menu bar and scroll down to the bottom of the screen.
Under the graph you should see an option to  , select this icon.
A dialog box allowing you to add a target will be displayed.
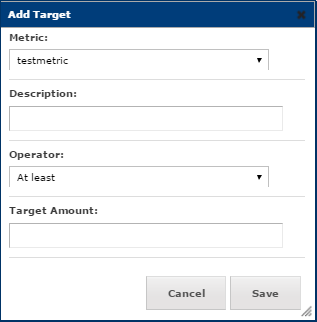
Complete the fields and click Save when done.
Calendar
In ServiceView there is a calendar that will show updates, changes and outages for each service. The calendar can be found in the service you select on a Calendar tab. Alternativly you can go to the home page and click Calendar on the top right.
In the calendar there are differnet views:
- Show all services
- Show just the chosen service
- Monthly
- Weekly
- Daily
There is also a manual Add event option. Click on this and fill in the required fields to ceate your own event for that service.
Disaster Recovery Plan
Each service that is in a data centre is able to be added to the disaster recovery plan.
The Disaster Recovery Plan is located at the bottom of the Dependencies page. You are able to add a data centre where the service is located by clicking Add Data Centre/Service Failover.
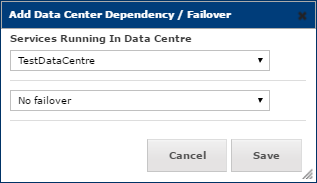
Fill in which data centre the service is located in and if the failover is done automatically or if it needs to be done manually. Click Save when done.
To edit existing Data Center Dependencies/Failovers, you are able to click on the Edit button and choose which team is responsible for the service (and the failover). You are also able to add how long the failover will take.
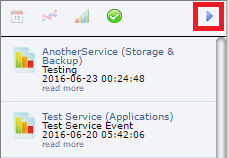
News Feed
There is a live news feed on the right hand corner. To open the News Feed click the arrow on the right hand side.
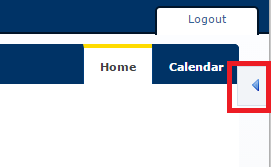
On this you can view updates made to the calendar, the metrics, your services or all your events. To hide the news feed again click the arrow in the top right corner.
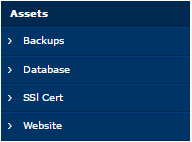
How to Add an Asset
An Asset consists of anything that is related to a service, but is not classified as equipment or infrastructure i.e. Certificates, Databases, Websites etc.
ServiceView provides users the ability to add an asset under the following categories:
- Backups
- Database
- SSL Cert
- Website
To add an asset, simply select the Assets option from the left menu bar. Then select the asset type you would like to add.
Once the relevant asset page has loaded you will then need to select the  icon in the top right corner.
Complete all fields and select Save once done.
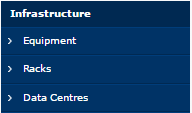
How to Add Infrastructure to a Service
Infrastructure in ServiceView consists of 3 categories:
- Equipment
- Racks
- Data Centres
To add Infrastructure to a service, select the Infrastructure option from the left menu bar.
Select the relevant infrastructure category and then select the  icon in the top right corner.
Complete all fields and select Save once done.
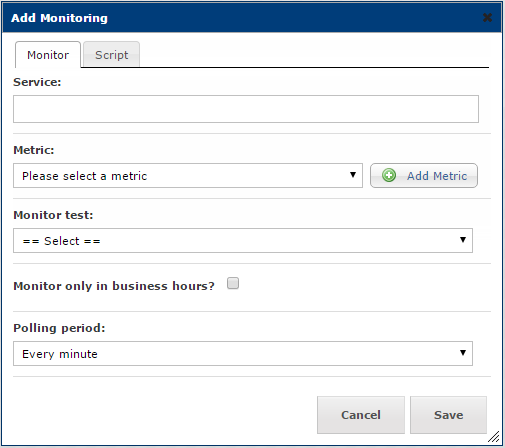
Monitoring
ServiceView is able to monitor services by using the phantom js browser plugin. This works for web based systems, such as blackboard where you are required to log in. The monitoring system can mimic a user and test the keystrokes.
Monitoring can also be done a number of other ways. This can be found under the Monitoring tab at the top of the individual Service page and then it will ask the user for a metric and to choose a monitoring test from the drop down. The period in which the monitoring is activated can also be chosen from a drop down.